Thermo-Calc 2021b Available Now

A new calculation type in the Property Model Calculator, Batch Calculations, allows users to import data from a spreadsheet or CSV file. The table above shows data in Thermo-Calc that was read in from a CSV file.

A Scheil Solidification Simulation for an Al-Si-Mg alloy using the Solute Trapping Model compared to a Classic Scheil Solidification Simulation and equilibrium. As the plot shows, the solute trapping model is closer to equilibrium as the solidification progresses.

A new Table View button in the graphical mode of Thermo-Calc allows users to easily convert plot results into tabular data, giving users an easy way to view results in a table and ensuring that all calculation types have a way to export data.
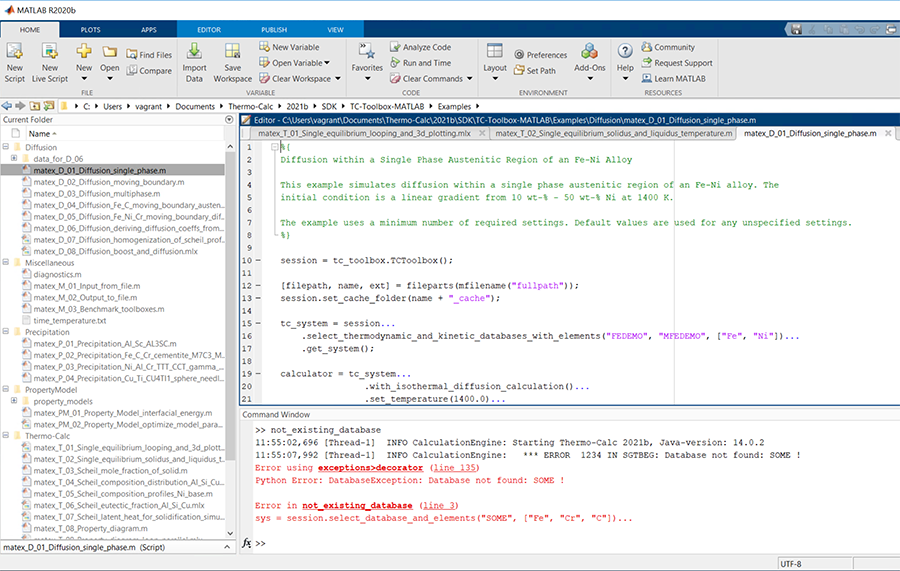
The newly rebuilt TC-Toolbox for MATLAB® includes nearly all calculation types available in Thermo-Calc Graphical Mode, is considerably more user-friendly than the legacy version, and comes with nearly 30 examples to help users get started in any of the modules you have a license for.

The CCT diagram for an Fe-C-Mn-Si-Cr-V alloy comparing calculated results with experimental data, made using the new CCT diagram model introduced in Thermo-Calc 2021b. The plot is included in the software as example PM_Fe_08_Fe-C_CCT.

Beginning with Thermo-Calc 2021b, Mixed Zero Flux and Activity Boundary Conditions can be used as functions in diffusion simulations.
Eight New and Updated Database
TCMG6.1: Magnesium-based Alloys Database
The magnesium-based alloys database was updated to version TCMG6.1. Users who have a license for TCMG6 and a valid Maintenance and Support Subscription receive this upgrade for free.