Thermo-Calc 2024b Available Now
Update Released
An update to Thermo-Calc 2024b was released on June 28, 2024. If you installed Thermo-Calc 2024b before June 28, you are encouraged to update your software as this update includes critical bug fixes.
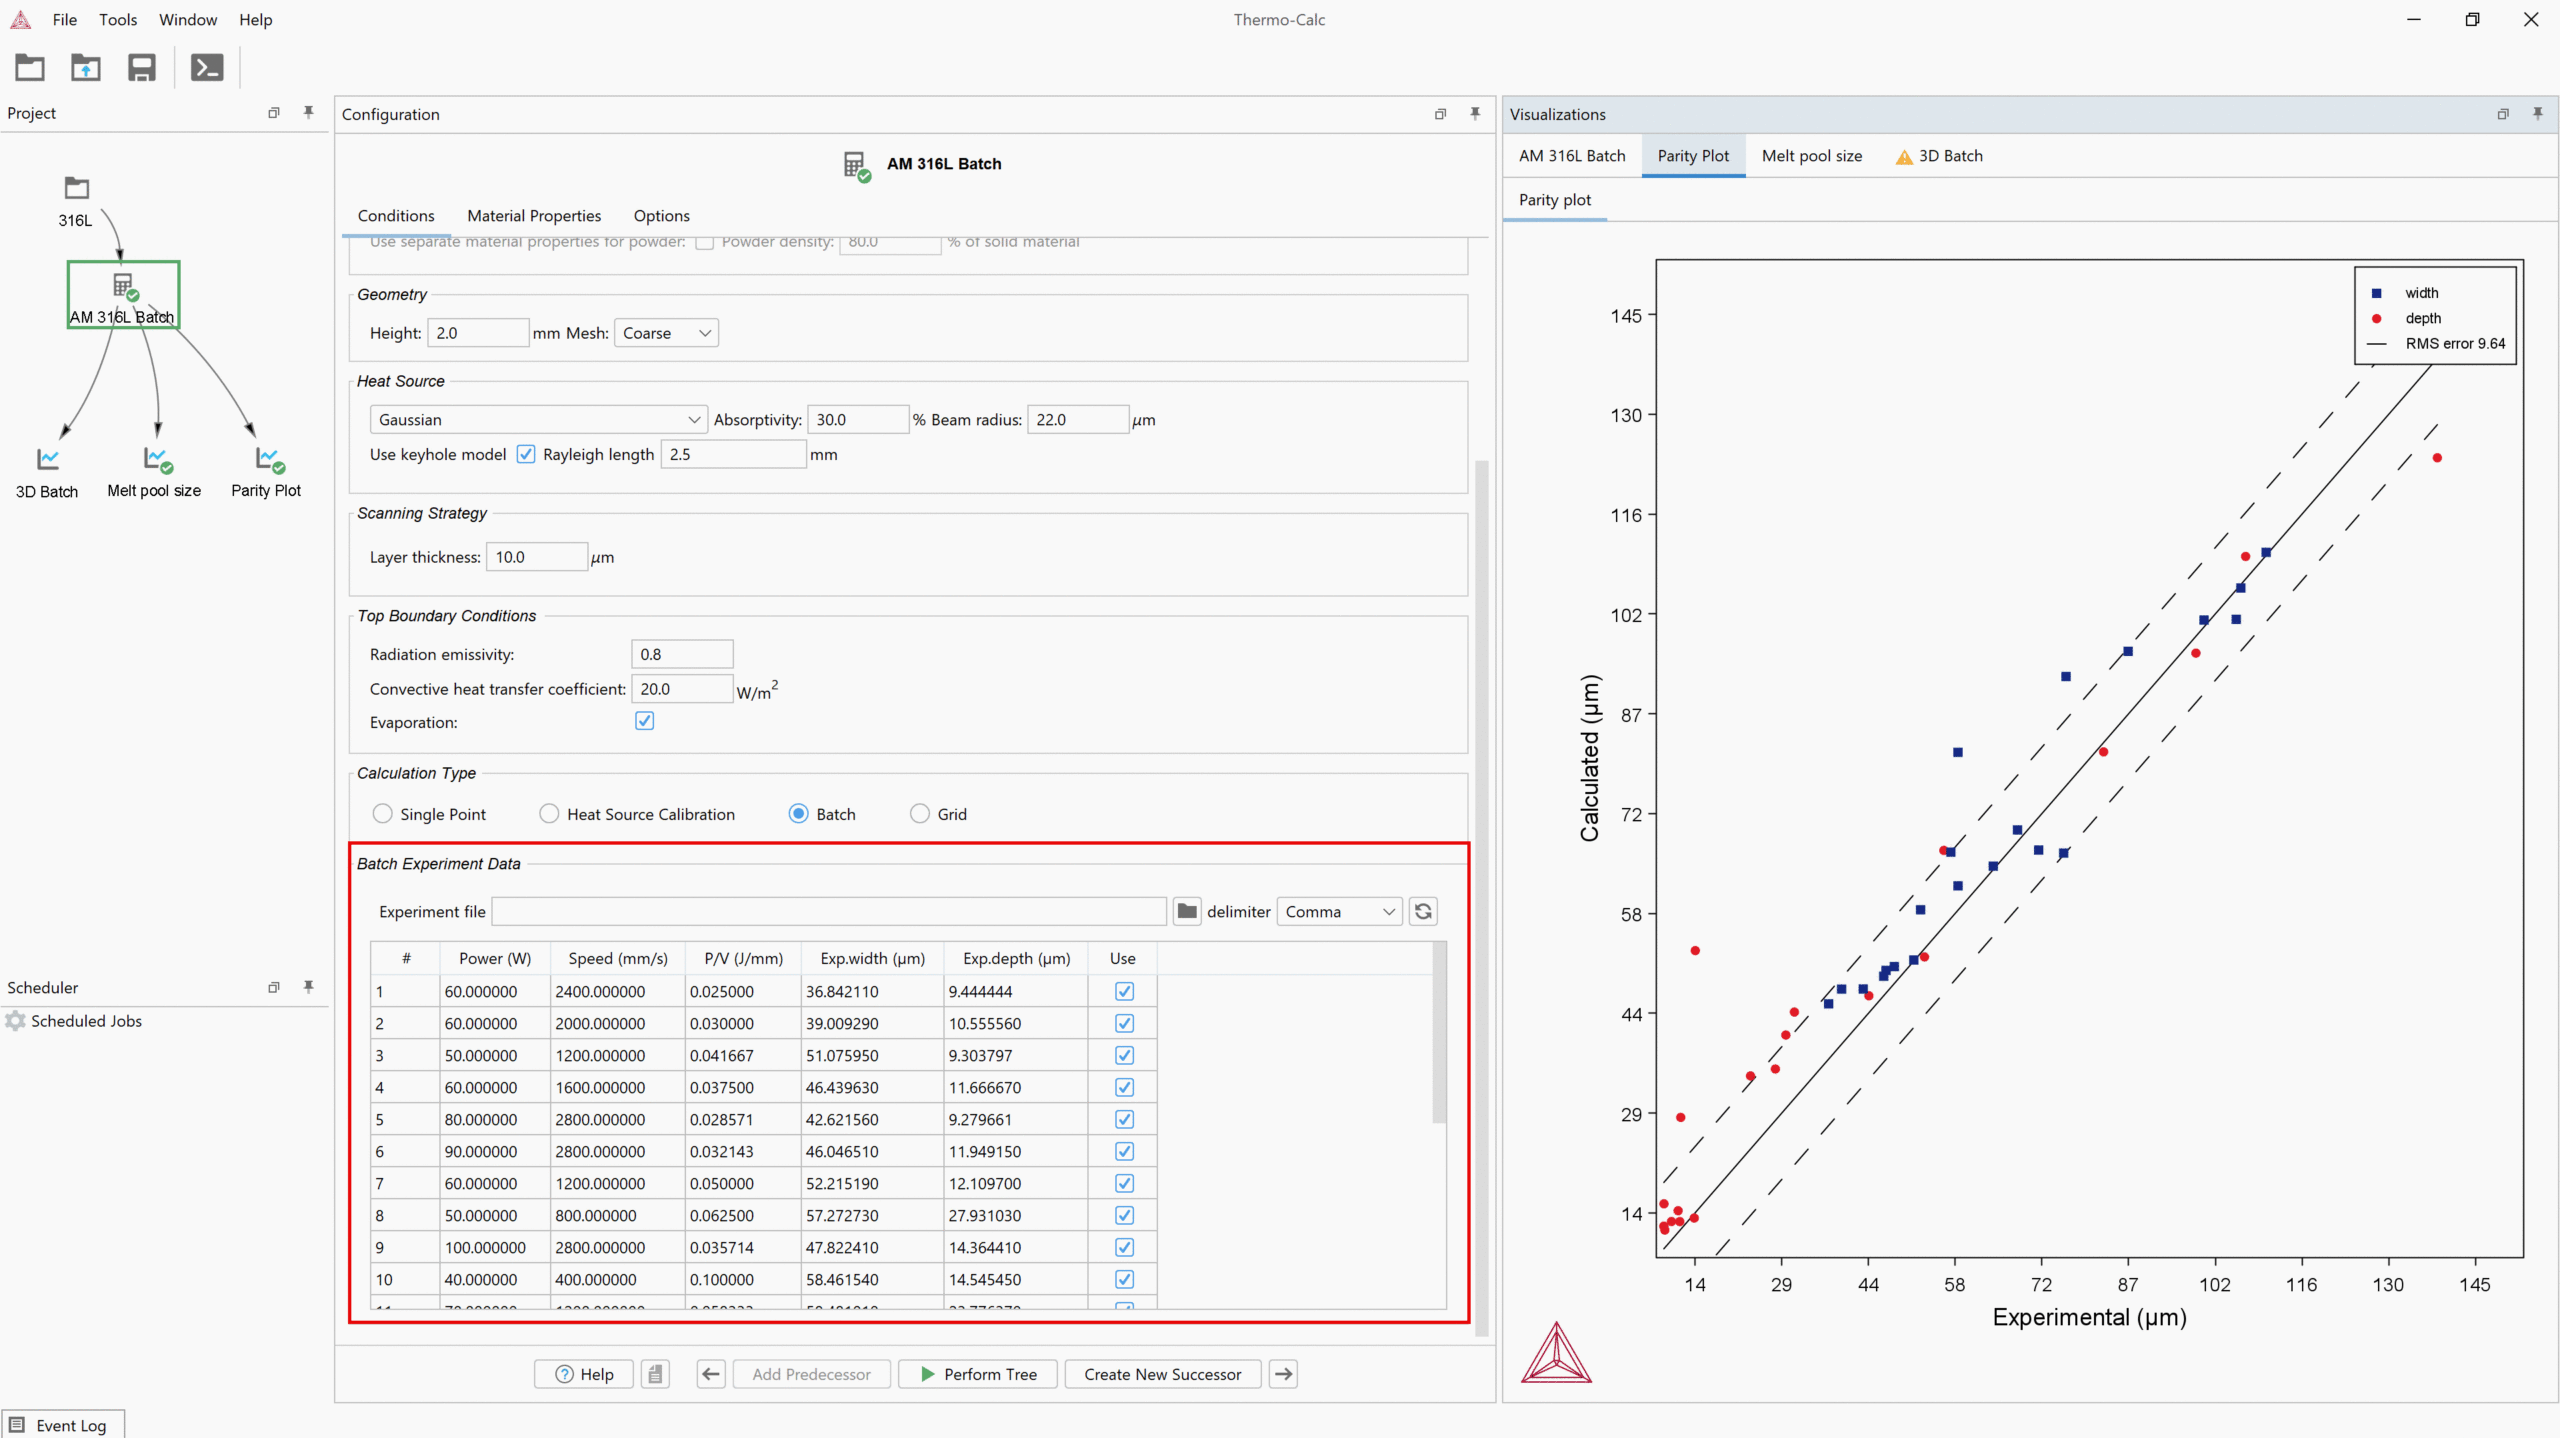
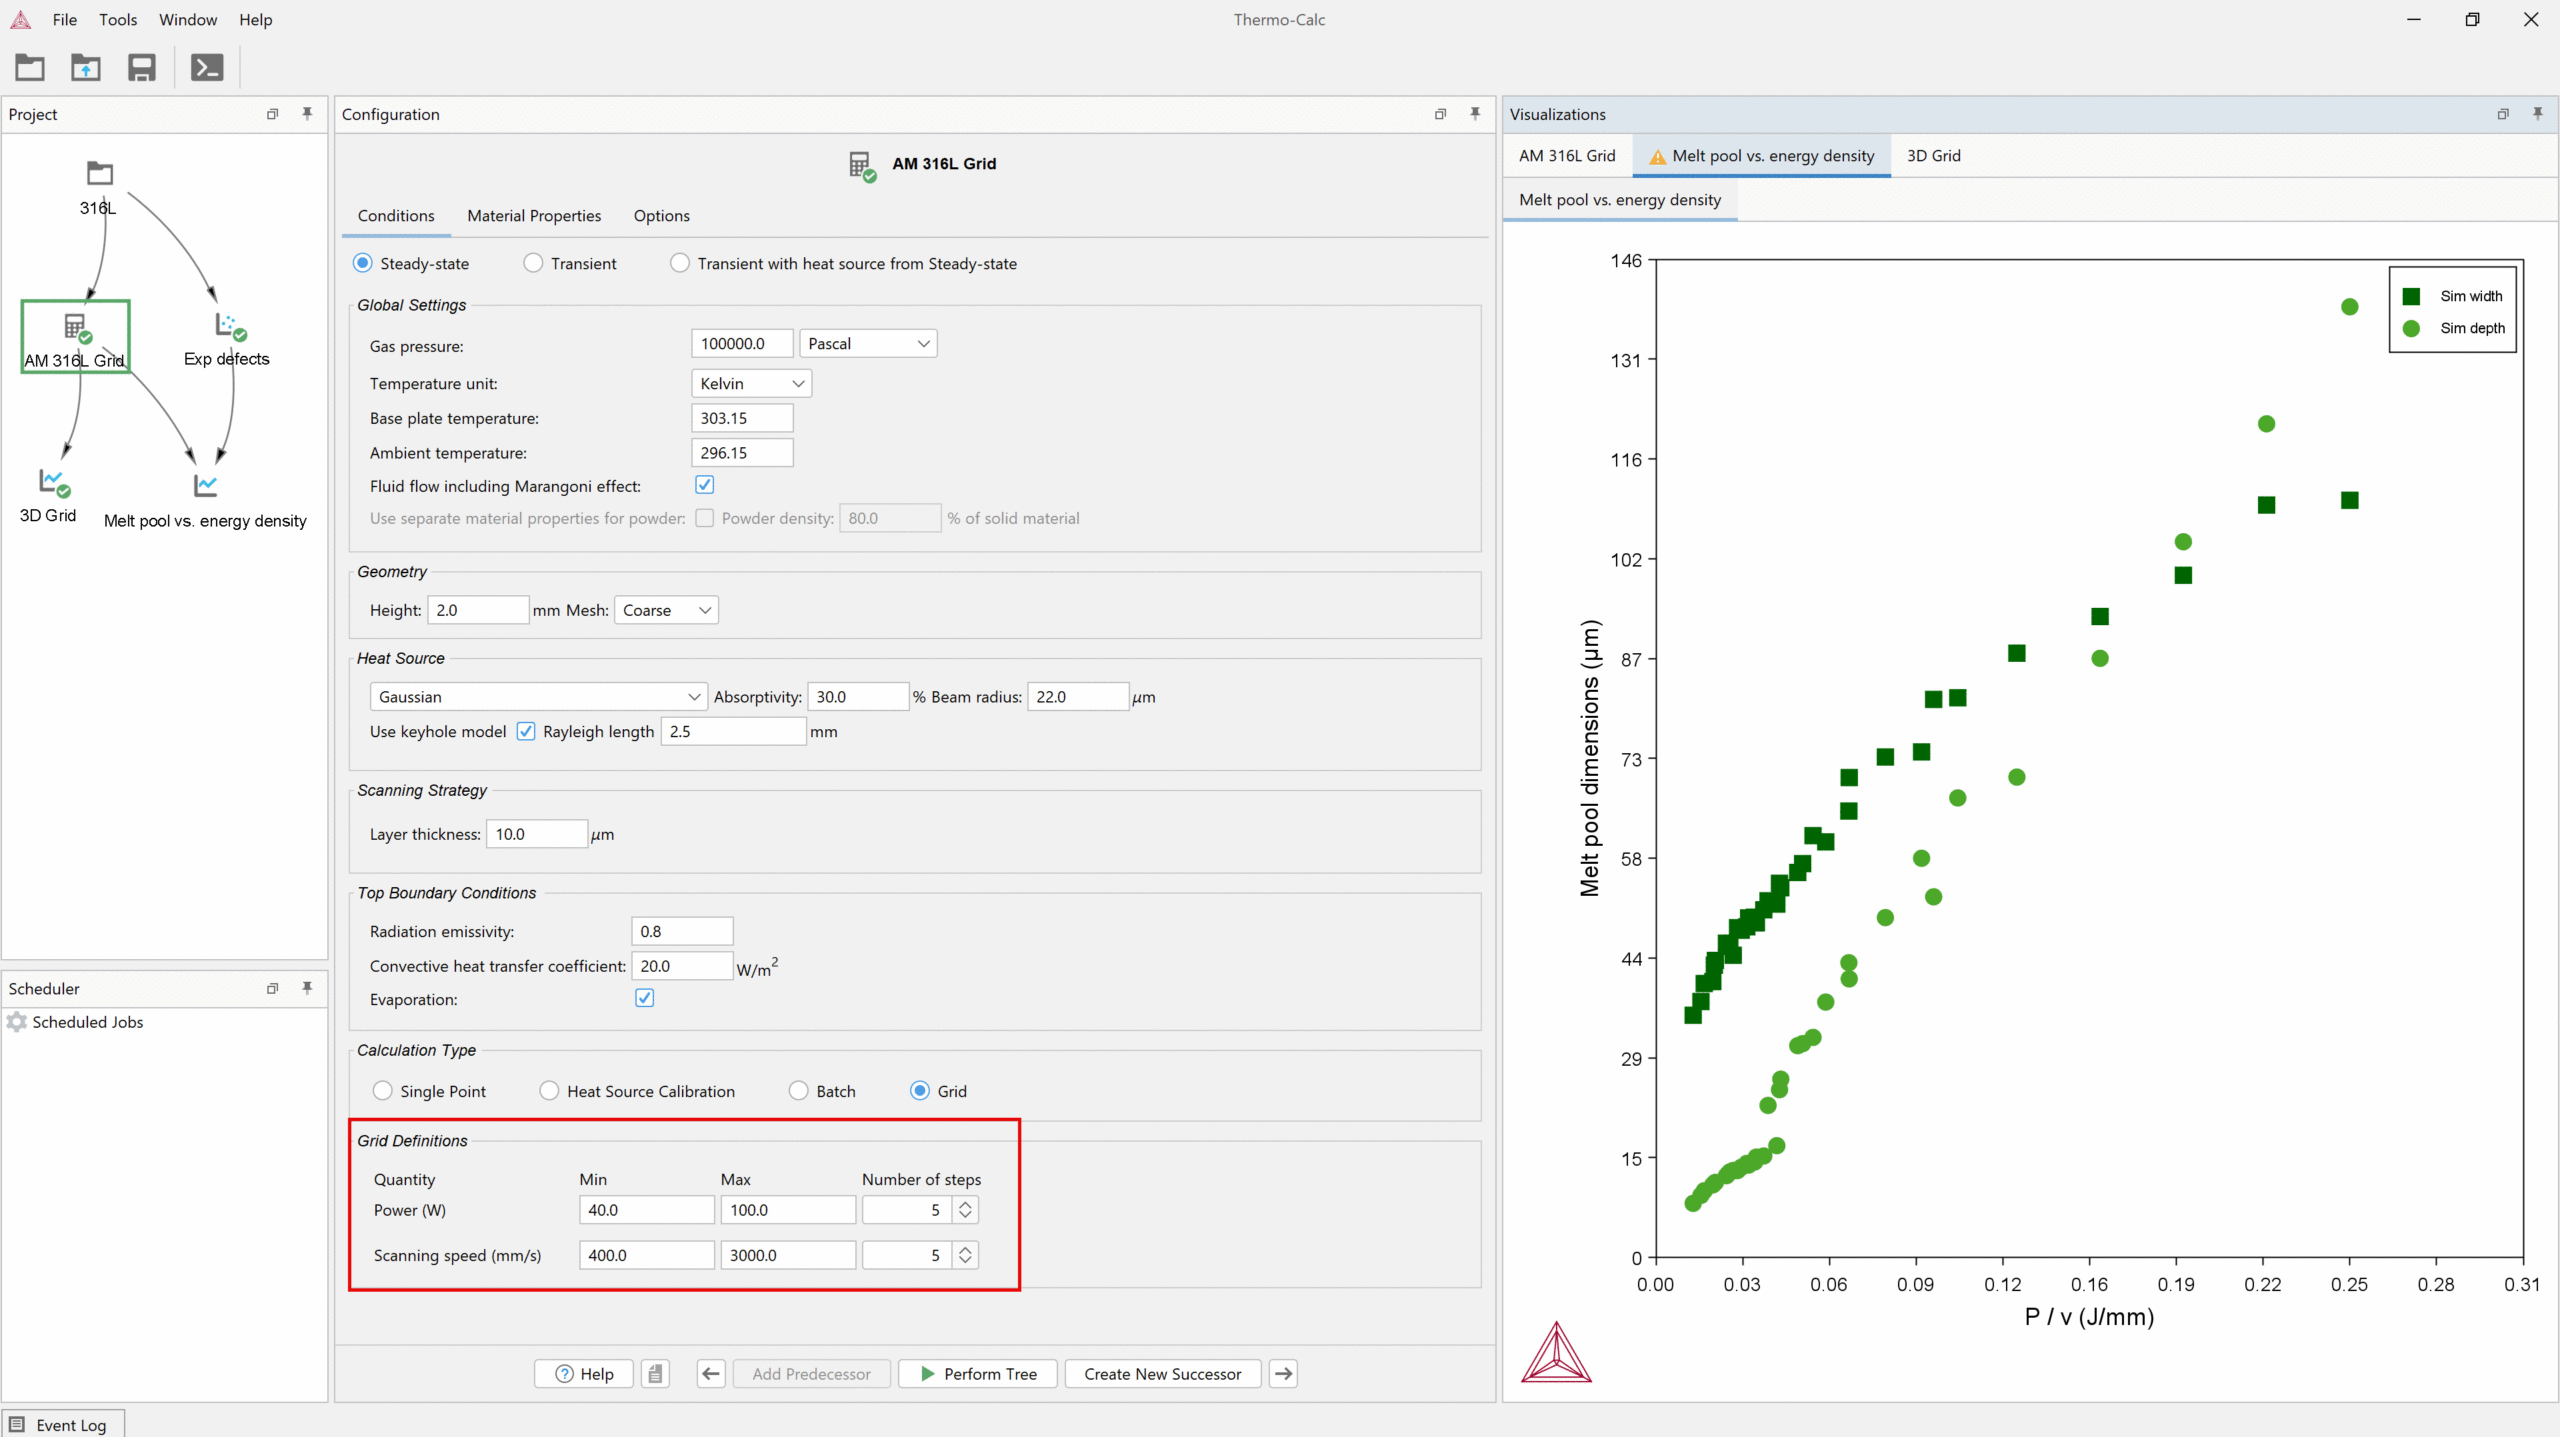
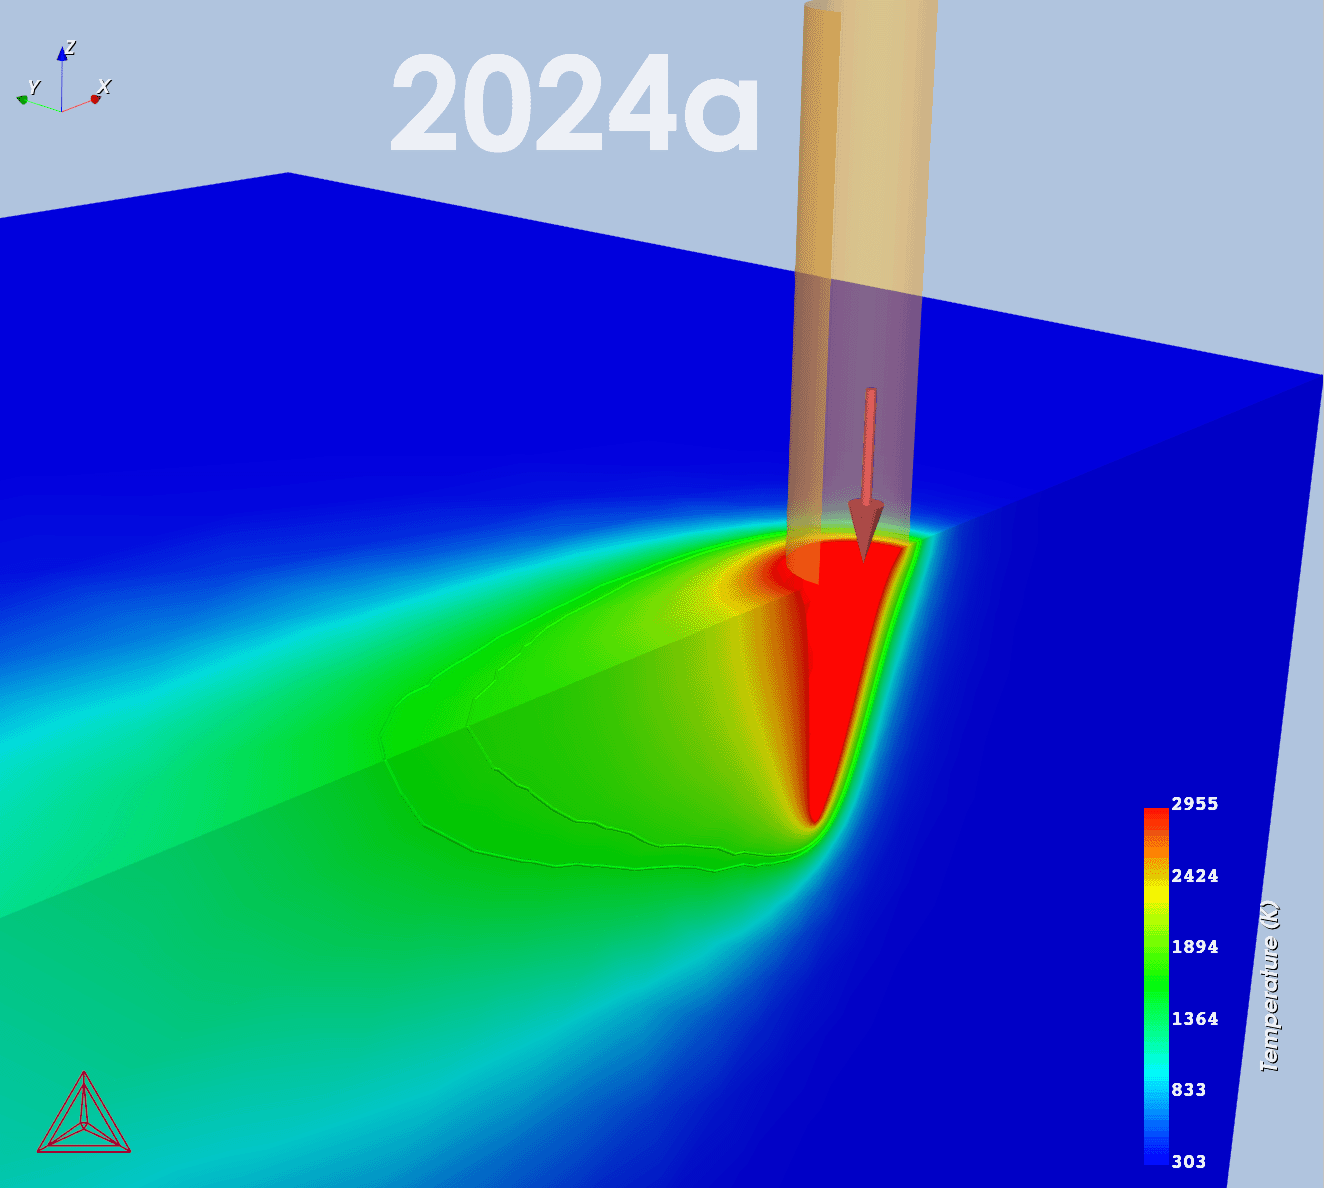
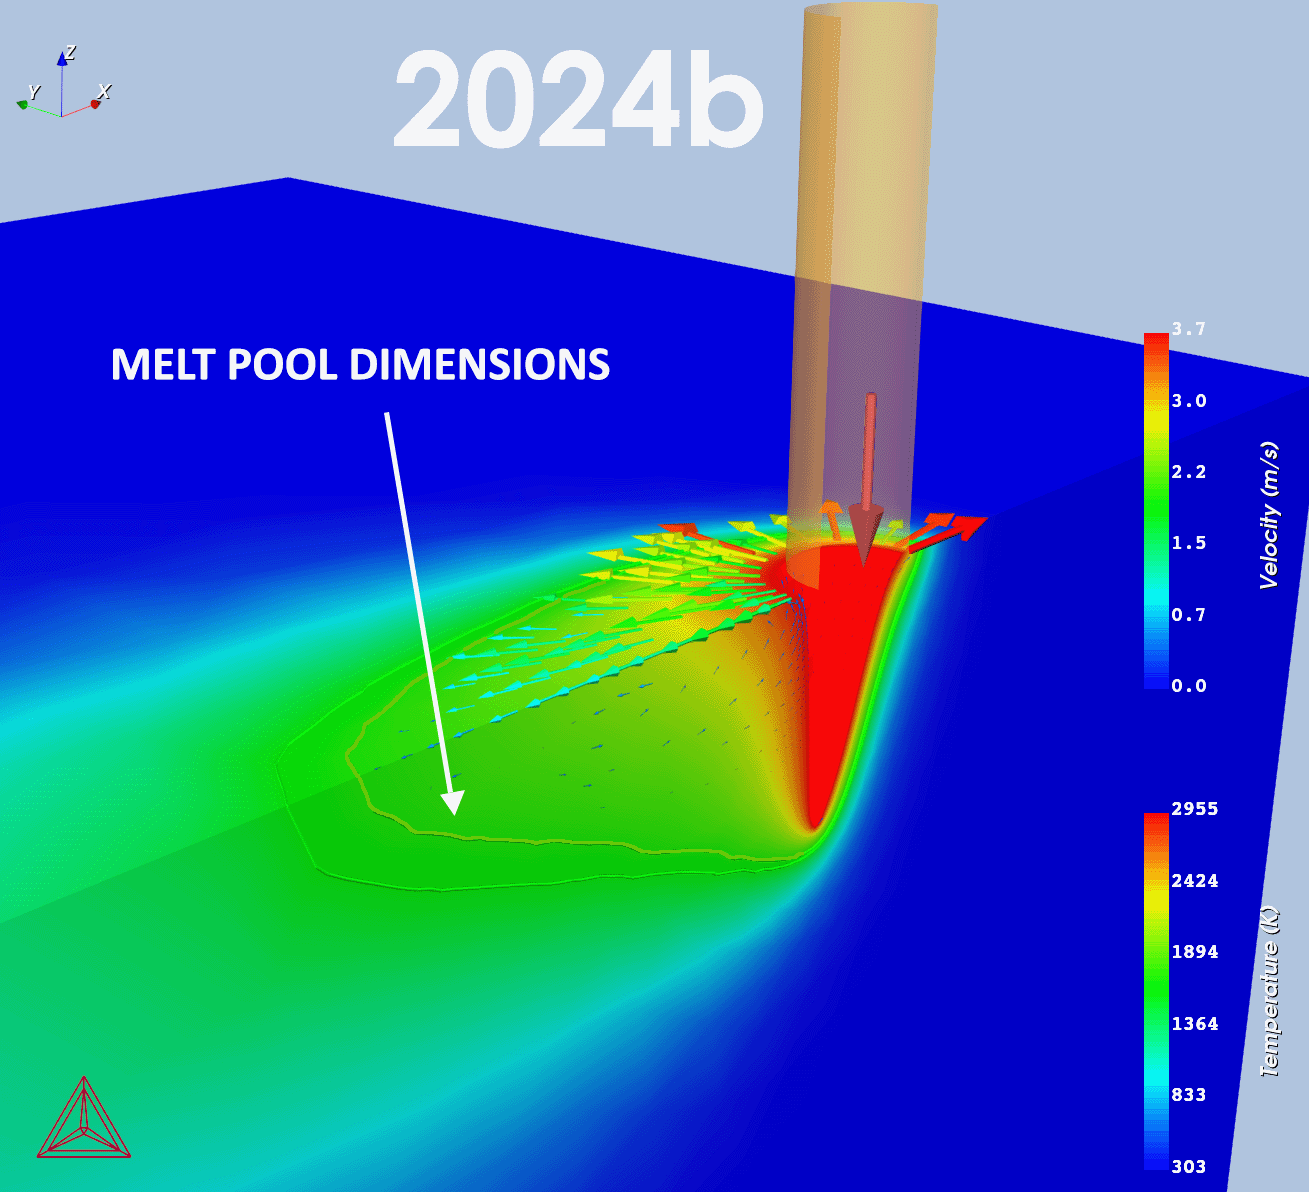
Five new examples are available demonstrating the various new features in the AM Module:
Two examples are included in the release demonstrating these two models:
One new example is included demonstrating the new elastic properties:
The physical models it is based on:
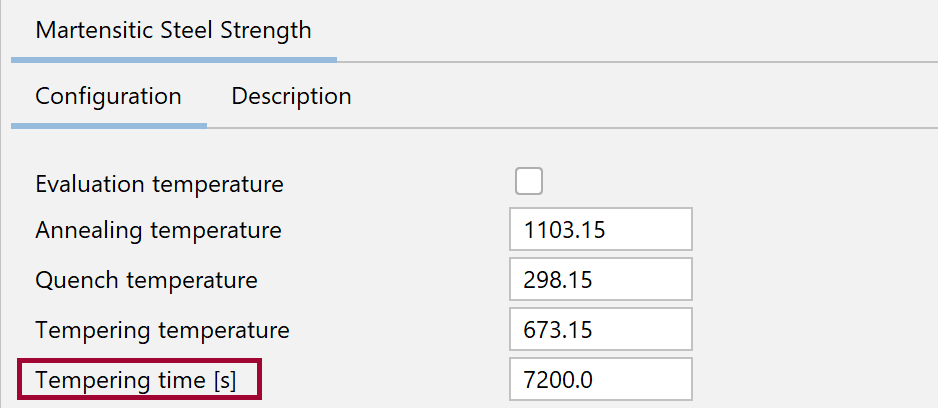
One example has been updated to demonstrate this new improvement:
Databases and Properties
New Databases
TCMO1: Molybdenum-based Alloys Database
Molybdenum-based Alloys Database (TCMO1) is a completely new thermodynamic and properties database for molybdenum-based refractory alloys that function at higher temperatures than Ni-based superalloys.
The database can be used for a variety of applications, especially aerospace components, electrical contacts, industrial machinery, and high-temperature furnace parts due to their excellent mechanical, thermal, and corrosion-resistant properties.
Molybdenum is also used in the production of high-strength steel alloys, which are crucial in the construction and automotive industries for their durability and resistance to corrosion and heat.
The database includes:
MOBMO1: Molybdenum Alloys Mobility Database
A companion mobilities database, MOBMO1, is also released to correspond to TCMO1.
The database includes:
TCNB1: Niobium-based Alloys Database
The Niobium-based Alloys Database (TCNB1) is a completely new thermodynamic and properties database for niobium-based refractory alloys that exhibit high melting temperatures and low density compared to Ni-superalloys.
The database can be used for a variety of applications, especially in aerospace and aviation industries for manufacturing superalloys that are heat-resistant and can withstand high-stress environments, such as jet engines and gas turbines.
Niobium alloys are also used in medical implants due to their biocompatibility and corrosion resistance. Additionally, they are used in the production of superconductors for applications like MRI machines and particle accelerators. In the automotive sector, niobium alloys are used for lightweighting and improving the strength of structural components.
The database includes:
MOBNB1: Niobium Alloys Mobility Database
A companion mobilities database, MOBNB1, is also released to correspond to TCNB1.
The database includes:
TCTI6: Titanium-based Alloys Database
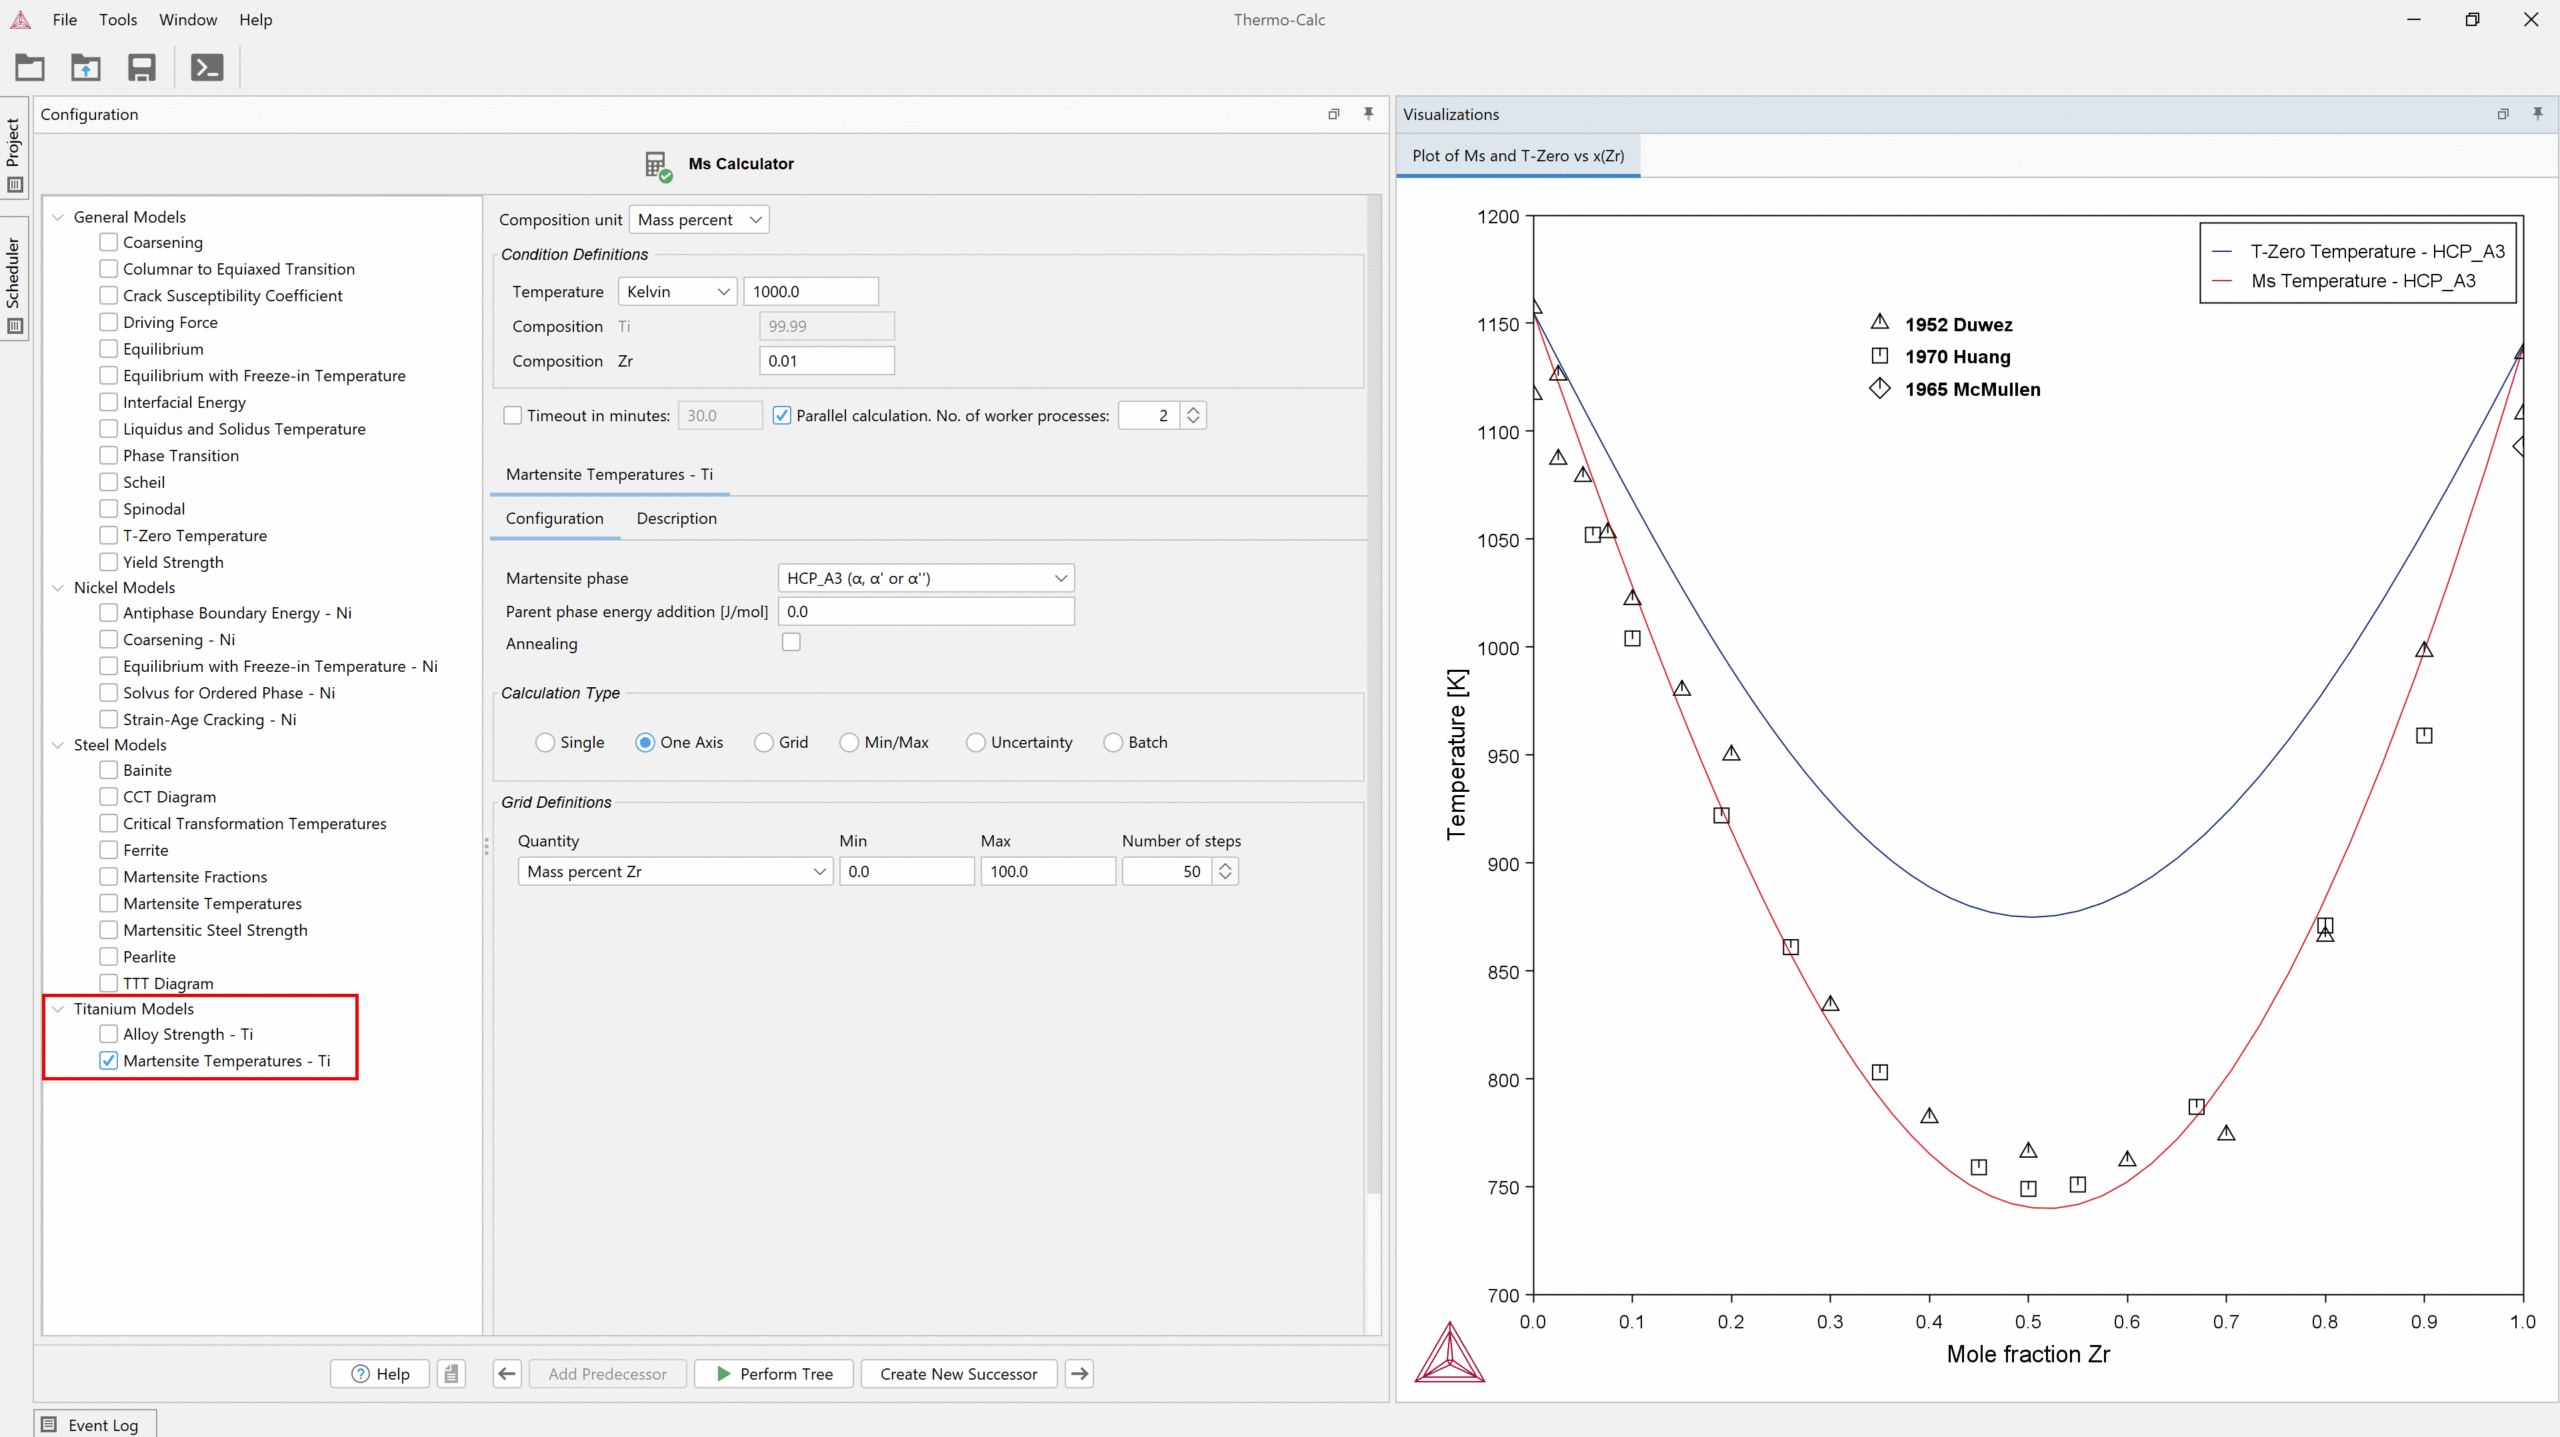
Users who purchase or upgrade to the new TCTI6 database receive the new Titanium Model Library for free.

![Effect of oxygen on Young’s modulus in HCP_A3 titanium compared to experimental data [1957Gra; 1966Fed; 1971Hsu].](https://thermocalc.com/wp-content/uploads/Images/Plots/youngs-modulus.svg)
