Thermo-Calc 2022a Available Now
Update Released
An update to Thermo-Calc 2022a was released on January 18, 2022 and a second on January 19, 2022. If you installed Thermo-Calc 2022a before January 19, you are encouraged to update your software as these updates includes critical bug fixes.
You can check whether you are running the most recent version by opening Thermo-Calc and navigating to the Help menu > About. You should be running version 2022.1.95234-411.
Webinar on Thermo-Calc 2022a Release
Watch our release webinar to learn about the exciting new features and new databases included in Thermo-Calc 2022a. In this webinar, two of the developers who worked on the release will speak about these exciting new developments.

The plot shows the gradual transition from a martensitic stainless steel on the left to Alloy 800 on the right at 650 °C, calculated using the new Material to Material Calculator. Neither material is expected to form any detrimental phase on its own at this temperature. However, we can see that within the transition zone of these two materials, the detrimental sigma phase can potentially occur (red line).
Typical applications of the Material to Material Calculator include:

This plot compares the ferrite mean grain radius with and without pinning for the BCC-A2 phase of an Fe-0.2C weight percent alloy at 722 °C. As can be seen in the plot, the pinning effect of the precipitate particles inhibits the grain boundary motion so that the overall grain size is reduced significantly.
New Nickel Model Library
Thermo-Calc 2022a introduces a Nickel Model Library – a package of pre-built Property Models that allow for easy set up of some of the most common calculations used by those working with Nickel-base alloys.
Three Property Models are included in the new Nickel Model Library:

The plot shows the lattice parameters for gamma and gamma prime plotted against experimental data from Nathal et al. It is a one axis calculation of a Ni0.6Mo0.92Ta12.5Al1.83Ti10.5Cr3.3W alloy evaluated with a range of 20 °C to 1000 °C using the Equilibrium with Freeze-in Temperature Nickel Property Model in Thermo-Calc. The freeze-in temperature is set to 1000 °C.
Scheil Improvements
Several improvements have been made to the Scheil calculator for this release:
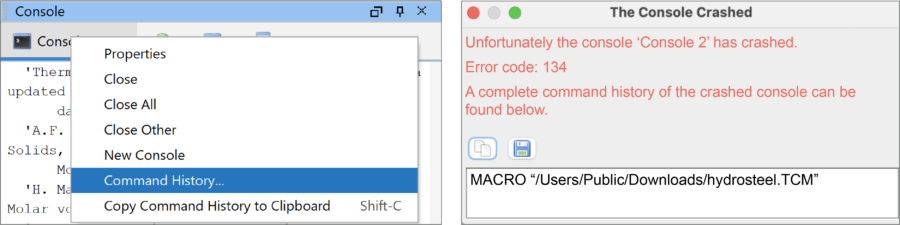
A new feature has been added to the Console Mode that allows users to copy their command history to the clipboard or save commands to a .tcm file (left), even after the program has crashed (right).
Several Quantities Now Available for Plotting and Tabulating
Several quantities in Thermo-Calc are now available for plotting and tabulating in the Graphical Mode. Previously, these quantities had to be entered as specific functions in the Functions tab, but they can now be accessed easily from a drop down menu in the function tab of the Equilibrium Calculator, and from many table and plot renderers. The newly included quantities are:
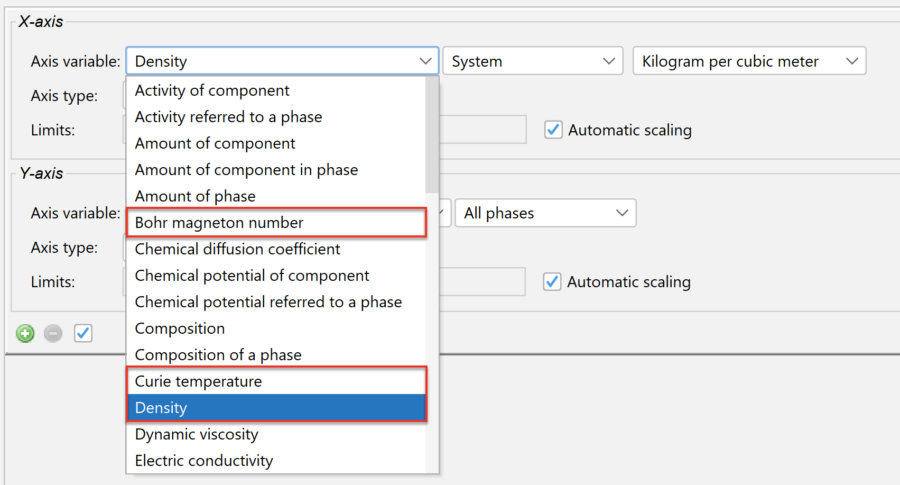
Several quantities in Thermo-Calc are now available for plotting and tabulating in the Graphical Mode, such as Bohr magneton number, Curie temperature, and density, as shown above.
Fourteen New and Updated Database
New Databases
TCPMAG1: Permanent Magnetic Materials Database
The Permanent Magnetic Materials Database (TCPMAG1) is a completely new thermodynamic and properties database. TCPMAG1 includes:
In addition to thermodynamic data, it has thermophysical properties data available for:
TCZR1: Zr-based Alloys Database
TCZR1 is a completely new thermodynamic and properties database for zirconium-based alloys. It can be used for a wide range of compositions from pure zirconium to very complex zirconium-based commercial zirconium alloys. TCZR1 includes:
In addition to thermodynamic data, it has thermophysical properties data available for:
MOBNOBL1: Noble Metal Alloys Mobility Database
This new kinetic database can be used for the atomic mobility descriptions of Ag-Au-Cu-Pd-Pt based alloys for the fcc and liquid phases. It is compatible and developed to be used with TCS Noble Metal Alloys Database (TCNOBL1). MOBNOBL1 includes:
Updated Databases
TCMG6.2: Magnesium-based Alloys Database
The magnesium-based alloys database was updated to version TCMG6.2. Users who have a license for TCMG6 and a valid Maintenance and Support Subscription receive this upgrade for free.
TCSLD4.1: Solder Alloy Solutions Database
The solder alloy solutions database was updated to version TCSLD4.1. Users who have a license for TCSLD4 and a valid Maintenance and Support Subscription receive this upgrade for free.
TCHEA5.1: High Entropy Alloys Database
The high entropy alloys database was updated to version TCHEA5.1. Users who have a license for TCHEA5 and a valid Maintenance and Support Subscription receive this upgrade for free.
TCAL8.1: Aluminum-based Alloys Database
The aluminum-based alloys database was updated to version TCAL8.1. Users who have a license for TCHEA8 and a valid Maintenance and Support Subscription receive this upgrade for free.
TCOX11.1: Metal Oxide Solutions Database
The metal oxide solutions database was updated to version TCOX11.1. Users who have a license for TCOX11 and a valid Maintenance and Support Subscription receive this upgrade for free.
TCNI11.0.1: Nickel-based Superalloys Database
The nickel-based superalloys database was updated to version TCNI11.0.1. Users who have a license for TCNI11 and a valid Maintenance and Support Subscription receive this upgrade for free.