Thermo-Calc 2016a Release
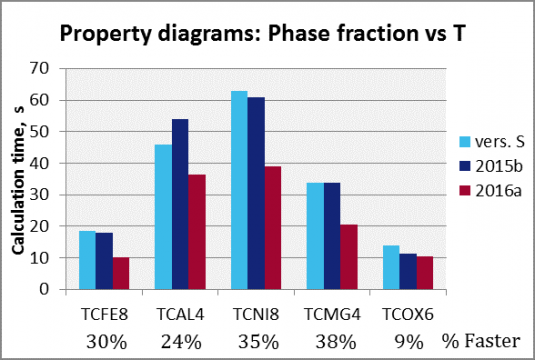
Benchmarking on various databases showed that property diagrams with phase fraction as a function of temperature were up to 38% faster in Thermo-Calc 2016a compared to Thermo-Calc 2015b.
New Precipitation Module (TC-PRISMA)
Beginning with Thermo-Calc 2016a, the Precipitation Module known as TC-PRISMA has been integrated into Thermo-Calc. This integration offers significant benefits over the previous stand-alone implementation of TC-PRISMA as it accesses features common to Thermo-Calc such as the System Definer and the improved graphics plotting.
Users who do not have a license for the Precipitation Module (TC-PRISMA) can now try it for free using one of the free demo database packages included in the software.
New Copper Databases
Thermo-Calc 2016a offers two new copper databases, one thermodynamic and one kinetic.
Updated Databases
Two existing databases have been updated for the Thermo-Calc 2016a release.