
Equilibrium and Non-equilibrium Calculations

Equilibrium Calculator

Calculate phase diagrams, stable phases, and more using this fundamental calculator included in all Thermo-Calc installations.

About the Equilibrium Calculator

The Equilibrium Calculator is a fundamental calculator within Thermo-Calc that allows users to easily set up and perform equilibrium and non-equilibrium calculations under a range of different conditions. The calculator is used in a range of different situations, including when calculating phase diagrams.  It is included in all Thermo-Calc installations.

Flexible Conditions

The Equilibrium Calculator in Thermo-Calc offers user’s large flexibility in terms of the different conditions that can be specified for the calculation. Examples of conditions (state variables) that can be set include: temperature, pressure, amount of component (for example mass, mass-percent, moles, mole-percent), amount of phase (mass, moles, volume), amount of component in a phase, chemical potential of component, activity of component, enthalpy, entropy, and more.

Four Calculation Types
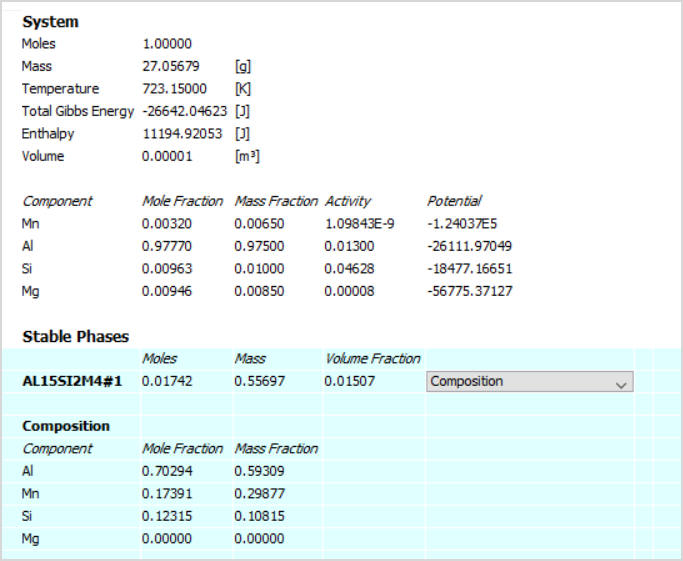
The Equilibrium Calculator includes four calculation types that allow users to make a range of calculations: single equilibrium, one axis, grid, and phase diagram, as explained below.

Single Equilibrium

This calculation type allows you to calculate the equilibrium for a specific set of conditions. The results of the calculation are provided in the form of a table, which shows the stable phases that are predicted to form under those conditions and the composition of those phases.

The table shows partial results of an equilibrium calculated at 450°C for Al-1Si-0.85Mg-0.65Mn (AA6082). Stable phases not shown in the image are FCC_A1 and MG2SI_C1. 

A table showing partial results of an equilibrium calculated at 450°C for Al-1Si-0.85Mg-0.65Mn (AA6082). Stable phases not shown in the image are FCC_A1 and MG2SI_C1. 

One Axis

This calculation type allows users to vary (or step in) one of the conditions specifying equilibrium. In this way, a series of equilibrium calculations is made where one of the conditions is changing, in steps, from one value to another. The results can be provided in a table or as a plot, as is the case for the example, which shows the volume-fraction of all stable phases present in a commercial Al-alloy, as a function of temperature.

A range of other properties can be plotted in a similar way, for instance composition of phases, heat capacity, density, and many more.

The plot shows a one-axis calculation of volume-fraction of stable phases as a function of temperature for Al-5.6Zn-2.5Mg-1.6Cu-0.2Si-0.15Mn (AA7075).

A plot showing a one-axis calculation of volume-fraction of stable phases as a function of temperature for Al-5.6Zn-2.5Mg-1.6Cu-0.2Si-0.15Mn (AA7075).

Grid

When selecting this calculation type, two conditions specifying the equilibrium are varied with equidistant steps. The result is provided as a plot, such as in the example here showing the viscosity in an Al-SI-Mg-Mn melt, just above the liquidus temperature.

The plot shows a grid calculation of dynamic viscosity calculated at 680°C for Al-1Si-yMg-xMn alloys.

A plot showing a grid calculation of dynamic viscosity calculated at 680°C for Al-1Si-yMg-xMn alloys.

Phase Diagram

In this calculation type, two conditions are specified and varied, just as with a grid calculation, but in this case phase boundaries (or zero phase fraction lines) are tracked and followed to generate a phase diagram. The result is provided as a plot, as shown in the example, where the Si content is varied on the x-axis and temperature on the y-axis.

The plot shows a phase diagram, also known as an isoplethal section, for Al-xSi-0.85Mg-0.65Mn.

A plot showing a phase diagram, also known as an isoplethal section, for Al-xSi-0.85Mg-0.65Mn.

Phase Diagram in Isothermal Conditions

Users can generate another type of phase diagram by varying the amounts of two elements at a constant temperature (isothermal conditions). Such an example is shown here, which is a phase diagram calculated at 1100°C for a ternary Fe-Cr-Mo system.

The plot shows a ternary phase diagram, also known as an isothermal section, for Fe-Cr-Mo at 1100°C.

A plot showing a ternary phase diagram, also known as an isothermal section, for Fe-Cr-Mo at 1100°C.

Databases

The Equilibrium Calculator uses the same thermodynamic and properties databases used for all Thermo-Calc calculations. However, if you want to calculate diffusion coefficients, a mobility database is also required. The mobility database contains information about the atomic mobility of individual components in relevant phases, and each mobility database corresponds to a specific thermodynamic and properties database. Information about our broad range of databases can be found in the database section.

Availability

The Equilibrium Calculator is included with all Thermo-Calc installations and is a fundamental part of the program. If you do not already have a Thermo-Calc license or you are interested in expanding your license, please contact us to discuss which license is right for you.

Learn More about the Equilibrium Calculator

Let Us Help You

Is Thermo-Calc Right for You?

Talk to one of our experts to learn whether our tools fit your needs.