Tips and Tricks: How to Plot Experimental Data
The topics covered in this blog post:
- Open your Thermo-Calc software. If the program opens in Graphical Model, switch to Console Mode.
- The experimental files are generated in the postprocessor of the POLY module. In the SYS prompt, type go poly.
- In the POLY prompt, type save. In the Save window, navigate to the folder where you want to save your file, name your file and click Save.
Note: This step is not always necessary but is used to avoid errors when making an EXP file without any data. Do NOT use it to make an EXP file with calculated results in the poly module.
- Type post to go to the postprocessor.
- Define the axes variables* that you want in your plot. For example, type set-diagram-axis x THCD to set the x-axis to thermal conductivity and set-diagram-axis y T to set the y-axis to temperature.
- Then type plot to make the axis variables show in the Results window.
- To create the experimental data file (.EXP file), type make file in the POST prompt. In the Save window, navigate to the folder where you want to save your file, name your file and click Save.
*Variables that are dependent on components or phases not present in the workspace can not be used.
PROLOG
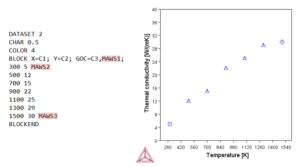
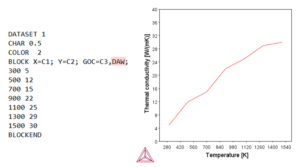
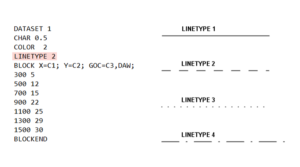
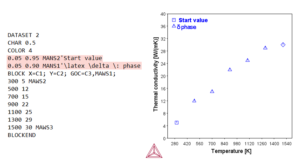
The PROLOG is where plot settings are configured. Here you can set the axis limits, axis type, tick length, plot title, and axis title. Change the values to fit the data you want to plot. The axis type can be set to either linear, logarithmic, or inverse. You can use the settings in the images in this article if you don’t have your own data.
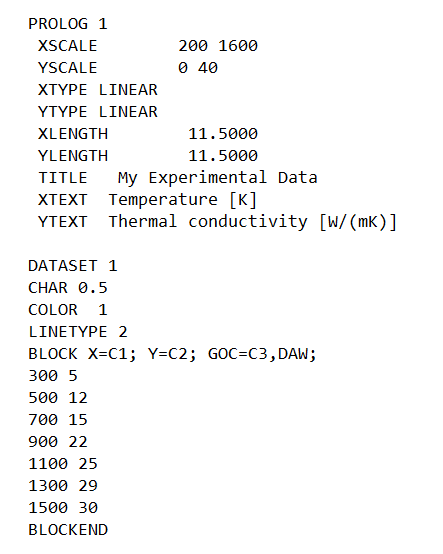
An example of how a PROLOG and DATASET can be written.
Console Mode
In Console Mode, the experimental file is read in the post processor of POLY Module.
- Go to the POLY-3 Module: At the SYS prompt type go poly.
- Go to the POST module: At the POLY prompt type post.
- At the POST prompt, type quick or append.*
- Select your file and click OK.
- Enter the Prolog and Dataset numbers you want plotted from your file (if applicable). If you want to plot more than one dataset, separate the dataset numbers with a space.
- At the POST prompt, type plot.
* Use quick if you are only plotting the .EXP file. Use append if you are plotting experimental data over an existing plot from a calculation.
To see the image larger, right-click and open in a new tab.
To see the image larger, right-click and open in a new tab.

