Application Example

Microsegregation During Solidification

This example shows how Thermo-Calc together with the Add-on Diffusion Module (DICTRA) can be used to investigate and predict microsegregation during solidification, also known as solute redistribution during solidification. The example uses a steel with composition Fe – 0.8% Mn – 0.7%Si – 0.03%P – 0.4%C.

Relevant Topics

  • Diffusion Module (DICTRA)
  • Scheil Solidification Simulation
  • Casting
  • Microsegregation during solidification
  • Solute redistribution
  • Steels and iron-based alloys

About the Microsegregation during Solidification Example

This example shows only a few of the capabilities of Thermo-Calc together with the Add-on Diffusion Module (DICTRA) to investigate and predict microsegregation (solute redistribution) during solidification.

It is based on a real case where the elemental distribution of a continuously cast steel was measured revealing the concentration of the elements Si, Mn, and P as sketched in Figure 1. The profile results from the well-known segregation across secondary dendrite arms. The interesting point is that the elements Si and Mn show the expected positive segregation (higher concentrations) in the interdendritic regions. The peak of the P content, on the other hand, is shifted compared to Si and Mn, and, in fact, shows negative segregation in the interdendritic region. This is unexpected and counterintuitive.

Calculated-microsegregation-during-solidification-using-thermo-calc

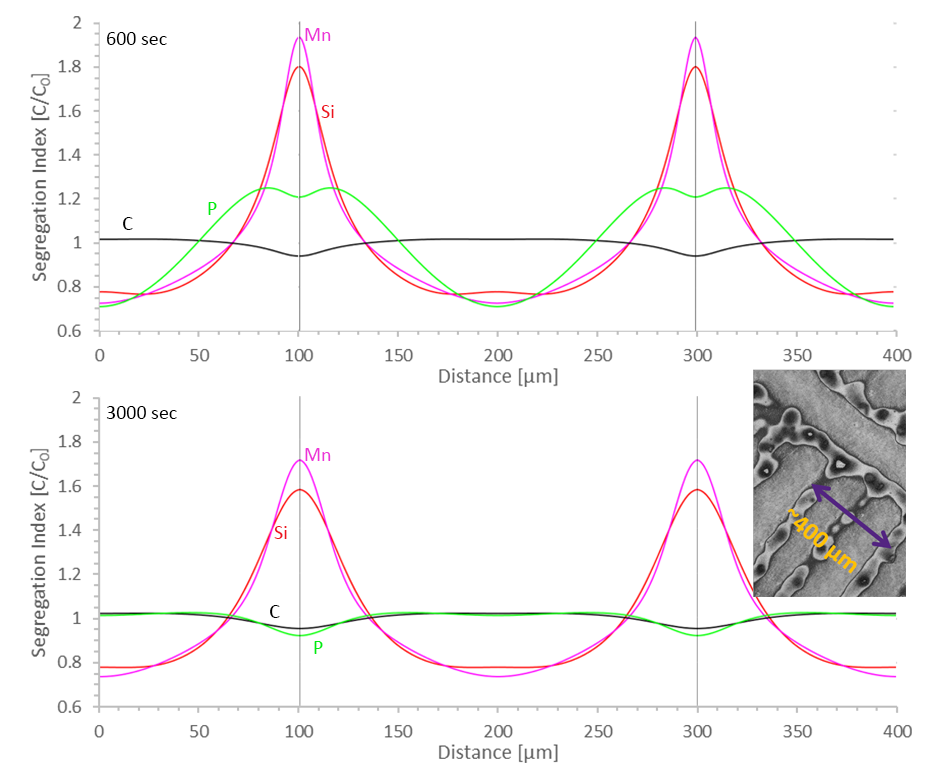
Calculated segregation of all elements just after final solidification (600 sec, top) and after cooling to 900 °C (3000 sec, bottom): just after final solidification there is positive P segregation in the final solidification pools between the dendrite arms. On further cooling, P redistribution is controlled by slow Mn and Si diffusion resulting in the unexpected, but experimentally observed, peak shift and negative P segregation.

This experimental finding is explained in this example using a simplified chemistry of the investigated steel, herein referred to as “Steel C”, with composition Fe – 0.8% Mn – 0.7%Si – 0.03%P – 0.4%C. The simplification of the real steel chemistry is made to make the calculations fast and the results easier to interpret. Similar calculations can of course also be performed for more complete chemistries and for far higher alloyed special steels or stainless steels. All calculations are performed using the steels database TCFE together with the mobility database MOBFE.

The example also touches on some very basic concepts for metallurgy and using Thermo-Calc, such as stable and meta-stable phase diagrams, Scheil and para- or partial-equilibrium Scheil solidification simulations.

The calculations are based on ones performed in the frame of a research project funded by the European Union called VESPISM – Virtual Experiments to Solve Problems in Metallurgy – conducted from 2001 to 2004 (https://cordis.europa.eu/project/rcn/55407_en.html).

How to Run the Calculation

To run this example, open Thermo-Calc and navigate to the Help Menu → Example Files…→ Diffusion Module – DICTRA. This example includes one calculation file:

This example includes a PDF with in-depth explanations of all the calculations and interpretation of the results.

Let Us Help You

Is Thermo-Calc Right for You?

Talk to one of our experts to learn whether our tools fit your needs.